
Which Metrics Matter?
Traceability in cashew supply chains generates data. But is that data being measured in ways that indicate something useful about the reliability, depth and currency of the supply chain record, or just because it's easy to collect?
The distinction matters because traceability metrics are increasingly used as evidence in procurement decisions, regulatory submissions and investor reporting. And a metric that measures the wrong thing, or measures the right thing inconsistently, can give buyers and operators a false sense of assurance.
This module sets out the measurement layer of the traceability stack: what gets measured, how, and what the numbers actually mean. It draws on the standards, protocols, technologies, resilience patterns and procurement frameworks covered in modules 1.1 to 1.5, and gives buyers and operators a practical basis for building and evaluating traceability metrics in cashew supply chains.
The first principle that needs mentioning is comparability. A traceability metric is only useful if it's measured the same way each time and, ideally, the same way across suppliers. A percentage figure for lot-level traceability coverage means very little unless the denominator is defined consistently: coverage of what, measured at which point in the chain, over which time period. So, before designing a metrics framework, agreeing on definitions is more important than agreeing on targets.
A Traceability Maturity Model
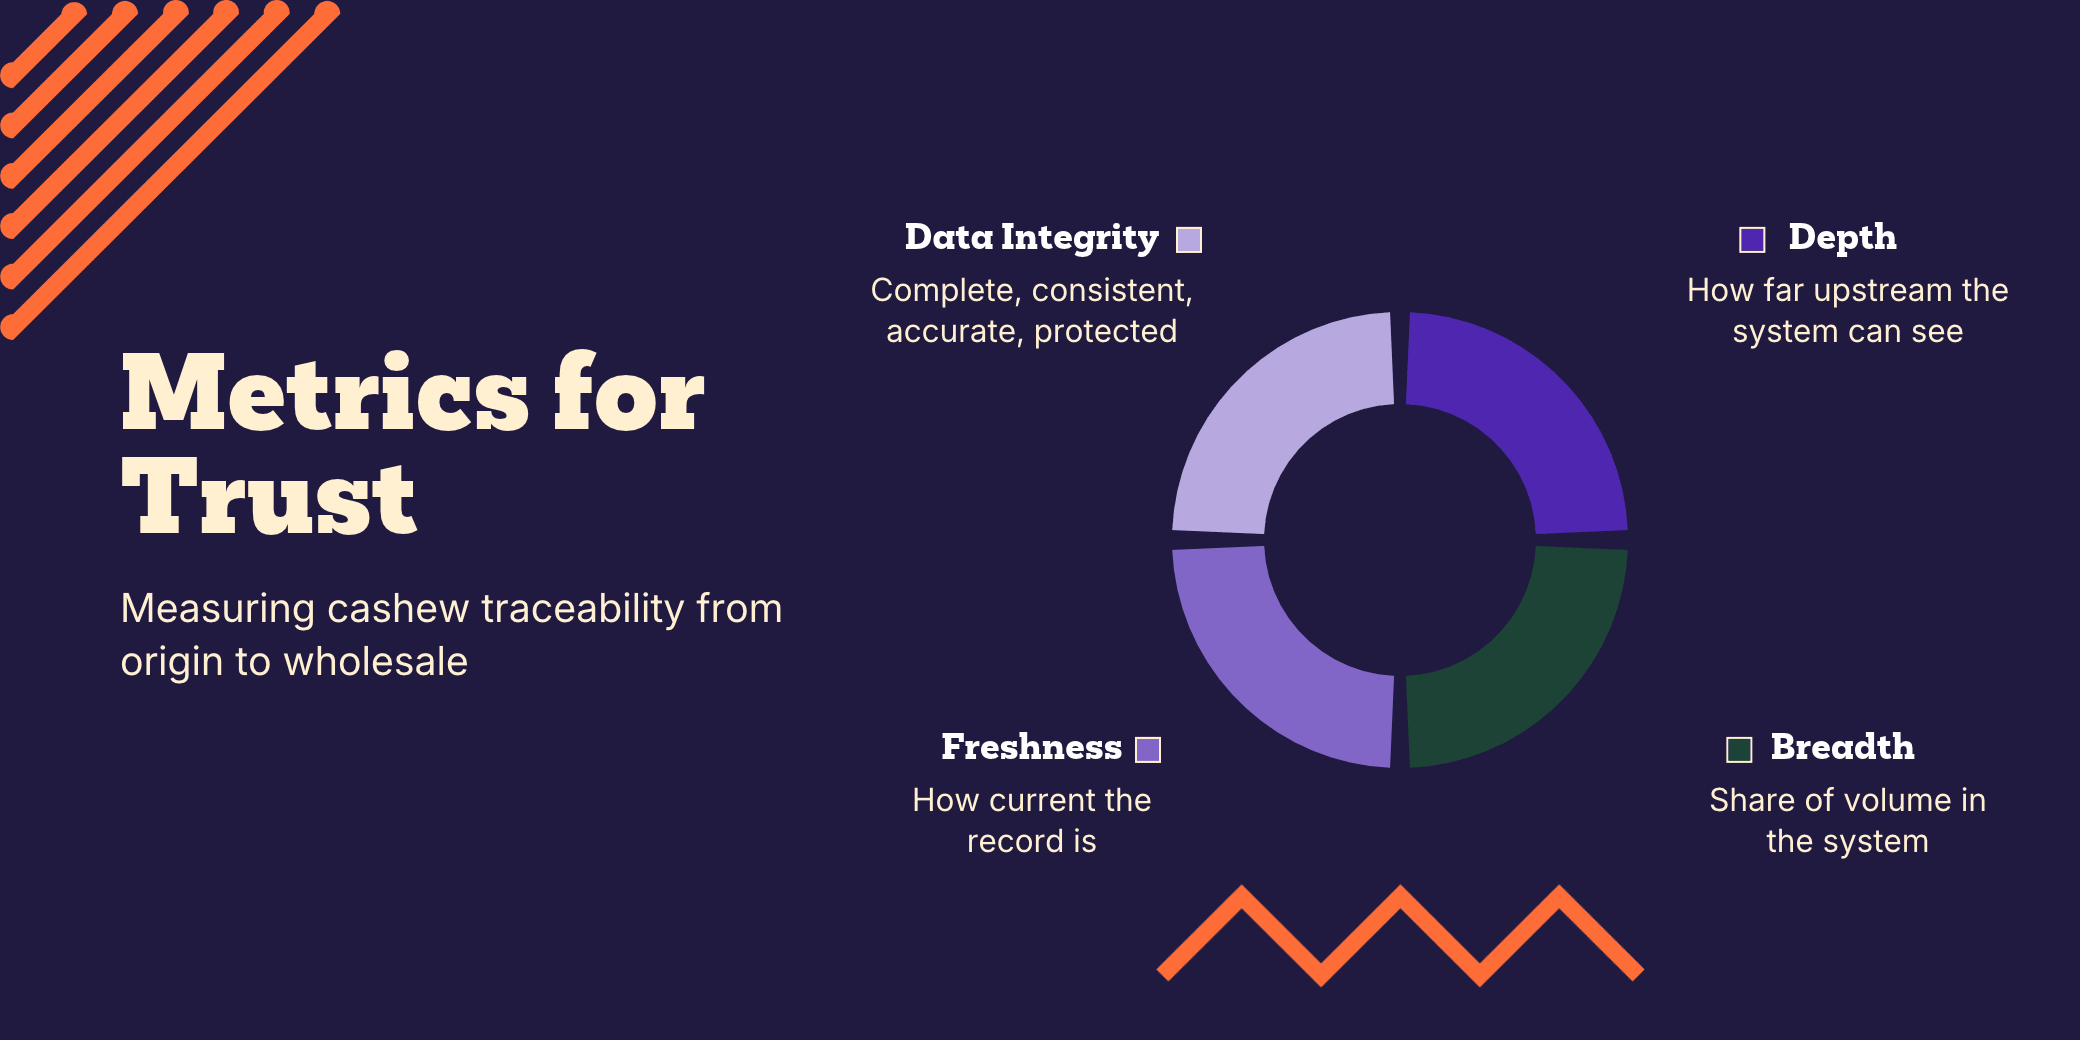
The framework below covers four maturity dimensions - depth, breadth, freshness and data integrity - and the operational design components that underpin them: Critical Tracking Events and Key Data Elements.
A mature system isn't simply one that traces further upstream; it's one that gets all of these right across the full supply chain. Gaps in any area undermine the overall picture, regardless of how strong performance is elsewhere.
Critical Tracking Events and Key Data Elements
Modern traceability systems are built around two core concepts from GS1's Global Traceability Standard: Critical Tracking Events (CTEs) and Key Data Elements (KDEs). Understanding these concepts is useful both for operators designing traceability systems and for buyers evaluating them.
A Critical Tracking Event is any point in the supply chain where traceability information must be captured: where a lot changes hands, changes form, or where a significant process is applied to it. For cashew, the principal CTEs are:
- Farmer registration and farm delivery
- Cooperative aggregation and warehouse receipt
- Processing batch creation
- Kernel grading and sorting
- Packing
- Export shipment
- Buyer delivery
A Key Data Element is the information that must be recorded at each CTE to maintain a complete and verifiable chain of custody. The KDEs relevant to each stage in a cashew supply chain differ by what the receiving party needs to do their job and satisfy their own downstream requirements.
At farm level, KDEs typically include producer identification, GPS location of the production plot, harvest season, quantity and certification status where applicable.
At cooperative aggregation, KDEs typically include supplier and cooperative identification, quantity received, date received and quality parameters including KOR (Kernel Outturn Ratio) and moisture content.
At processing, KDEs typically include batch number, input lot references (preserving the parent-child relationship described above), input and output quantities by grade, yield, and quality testing results including aflatoxin, moisture and any other parameters relevant to the destination market.
At export, KDEs typically include container number, shipment date, destination, certification documentation and the phytosanitary and customs records required by the importing country.
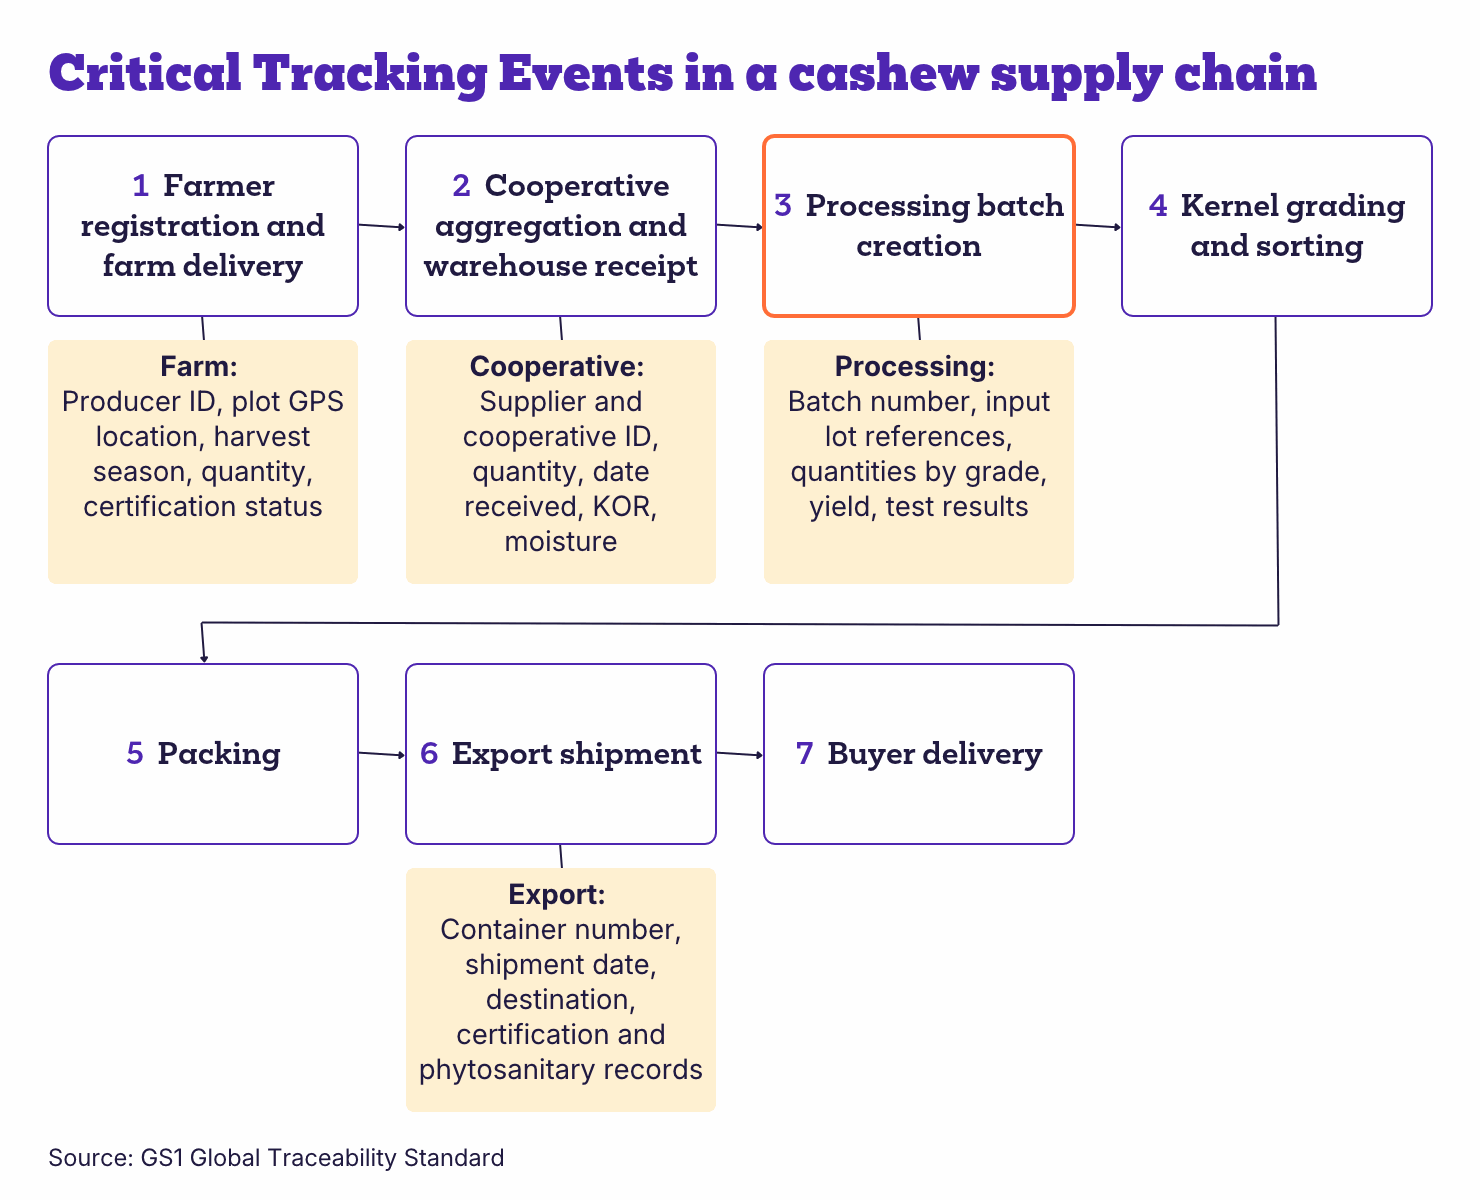
Mapping CTEs and KDEs before selecting a technology platform is one of the most practical steps an operator can take in traceability system design. It defines what the system needs to capture before any decision is made about how to capture it. It also provides the basis for evaluating whether an existing system is complete: a gap analysis against the CTE and KDE framework will identify which handover points are undocumented and which data fields are consistently missing.
Depth
Depth measures how far upstream a traceability system can see, and can be understood as a progression through levels:
- Level 1: processor identification
- Level 2: cooperative or aggregator identification
- Level 3: farm-level origin
- Level 4: geospatial production plot identification
In cashew supply chains, depth is particularly significant because the most important social and environmental risks - farmer welfare, land use and labour conditions - are concentrated at the farm and cooperative level rather than at the processing facility. A traceability system that reaches only to the first supplier tier provides limited evidence on the questions buyers and regulators are increasingly asking.
GS1's Global Traceability Standard provides a framework for defining and measuring depth in food supply chains, including the concept of a traceability tier as a countable unit. For buyers comparing cashew suppliers, asking each to state their traceability depth - and defining what counts as a tier consistently across suppliers - is a more informative question than asking whether they have a traceability system at all.
Breadth
Breadth measures what proportion of a supplier's total volume passes through the traceability system, and can be expressed at multiple levels:
- 100% of export kernels
- 95% of raw cashew nuts purchased
- 80% of cooperative suppliers registered
A processor with a sophisticated digital traceability platform covering 40% of throughput has lower effective breadth than one with a simpler system covering 95%. Breadth gaps typically occur at the points in the chain where digital infrastructure is weakest - farm and cooperative level, as discussed in module 1.2 - or where certain product grades or customer channels are excluded from traceability requirements. A breadth metric should specify the denominator clearly: percentage of total volume, percentage of certified volume, or percentage of volume destined for a specific market.
Freshness
Freshness measures how current the traceability record is, and like depth it can be expressed as a progression:
- Annual certification review
- Monthly supplier update
- Real-time lot movement recording
An annual certificate is a one-off snapshot, while a lot database updated at each handover point provides a continuously refreshed record. The gap between them is significant for incident response, as documented in module 1.4: the older the record, the slower and less precise the trace-back. Freshness can be measured as the average lag between a physical event - a lot moving between parties - and the corresponding record update, or as the proportion of records updated within a defined time window. Either approach requires a timestamp on each record entry, which is one reason timestamp discipline is worth building into traceability protocol design from the outset.
Data Integrity
Data integrity is a broader and more useful concept than accuracy alone. Numerical accuracy matters, but traceability failures more commonly arise from missing data, inconsistent lot identifiers, duplicate records, unverified claims and unauthorised changes - none of which 'accuracy' fully captures. A more complete picture of data integrity covers four components:
Completeness: Are all required data fields populated at each handover point, or are records partial?
Consistency: Do lot identifiers, unit measures and data formats match across systems and between parties, or do mismatches create gaps at handover?
Accuracy: Does the data reflect physical reality; correct quantities, dates, origins and test results?
Integrity: Has the data been protected from unauthorised change, and is there an audit trail showing who entered or amended each record and when?
Data integrity is the hardest of the four maturity dimensions to measure directly, because doing so requires comparing records against an independent source of truth: physical stock counts, laboratory test results or third-party verification visits. Mass-balance reconciliation, covered in the following section, is one of the most practical tools for detecting integrity problems without requiring full independent verification of every record.
Mass-Balance Accuracy Explained
Mass balance is a straightforward concept in principle but is often misunderstood in commodity supply chains. Before addressing how it works, it's worth distinguishing three related but distinct concepts that are sometimes conflated:
1. Physical Traceability
This is the ability to follow actual physical material through the chain. A system with strong physical traceability can demonstrate that a specific kernel batch came from specific raw cashew nuts received from a named cooperative on a named date. This is the gold standard of traceability but the hardest to achieve, particularly where aggregation and splitting occur across multiple handover points.
2. Administrative Traceability
This is the ability to reconstruct documentation. A system with strong administrative traceability can demonstrate that a certificate, invoice and production record correspond to a specific shipment. This is more commonly achieved than physical traceability but doesn't by itself prove that the documented material matches what was physically handled.
3. Mass-balance Traceability
This is the ability to demonstrate that quantities entering and leaving a system are logically consistent. For instance, 10 tonnes of RCN can’t generate 8 tonnes of kernels at a standard yield. If the numbers don't reconcile within expected tolerances, something in the record is wrong.
These three concepts are not interchangeable, and a system that performs well on one may perform poorly on another. Administrative records can be complete and internally consistent while physical traceability is absent. Mass balance can reconcile correctly while containing incorrect origin information if the initial data entry was wrong.
This last point is worth stating clearly: a perfectly balanced system does not prove origin. It demonstrates numerical consistency, not the accuracy of the underlying claims about where material came from.
| Type | What it demonstrates | Limit |
|---|---|---|
| Physical traceability | Actual physical material can be followed through the chain | Hardest to achieve where aggregation and splitting occur |
| Administrative traceability | Certificate, invoice and production record correspond to a specific shipment | Does not prove the documented material matches what was physically handled |
| Mass-balance traceability | Quantities entering and leaving a system are logically consistent | Does not prove origin |
Source: Cashew Coast Industry Guide, module 1.6.
With that context established, mass balance in a cashew processing context works as follows. A cooperative delivers 10,000 kg of raw cashew nuts to a processor. The expected kernel yield for that grade and origin is approximately 22%, which should produce around 2,200 kg of cashew kernels. If the processing record shows 2,800 kg of kernels produced from that lot, the variance requires explanation: either the yield assumption is wrong, the input quantity was mis-recorded, product from another lot has been incorrectly attributed, or there is a more serious data integrity issue.
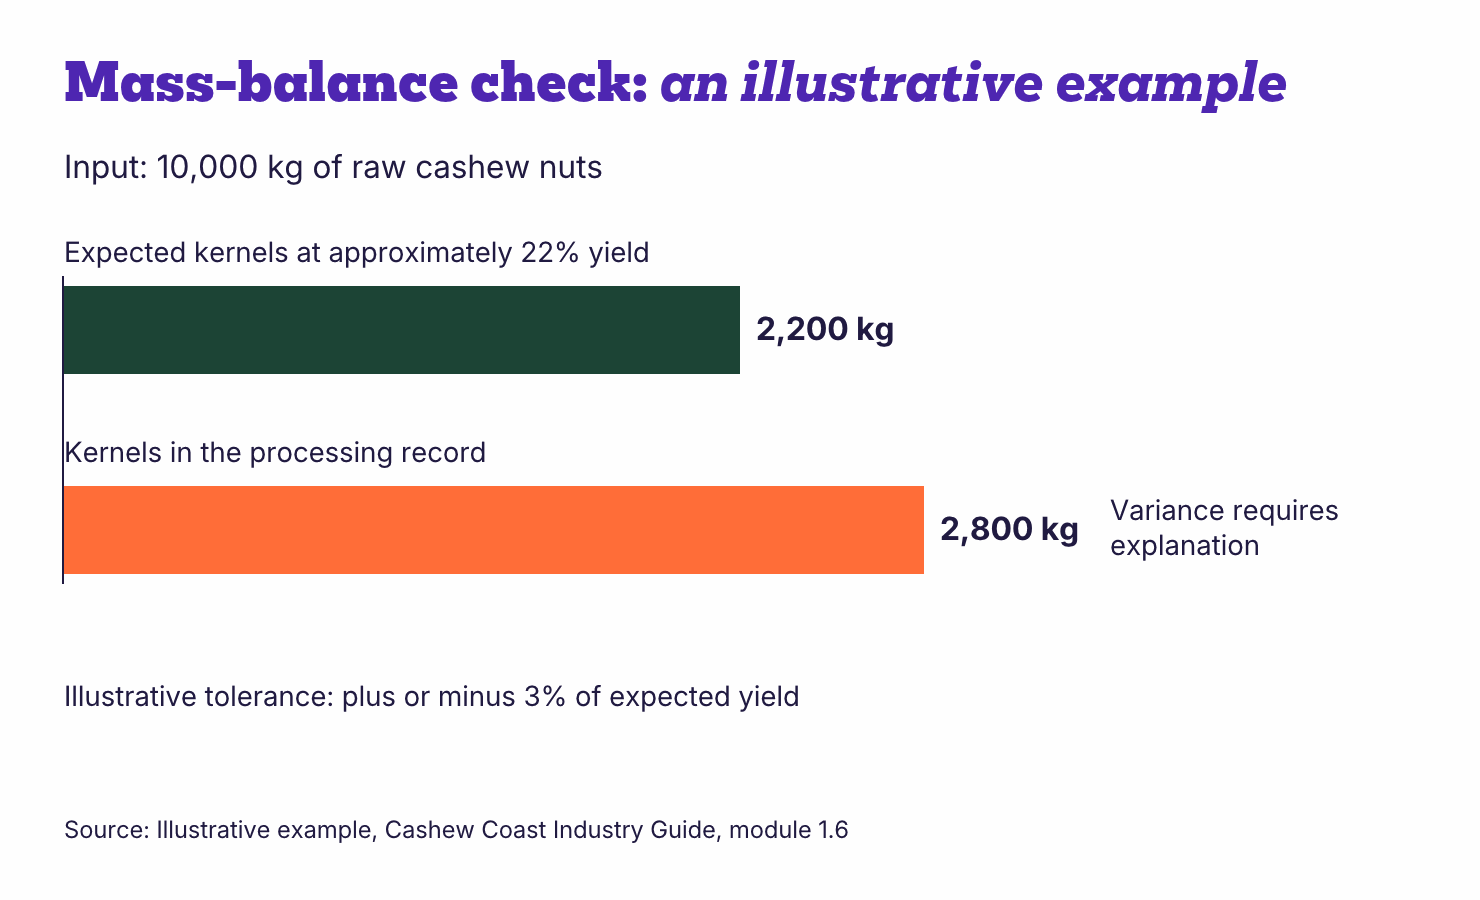
A processor whose lot records consistently reconcile within a defined tolerance, say plus or minus 3% of expected yield, is demonstrating a level of data discipline that a certificate can’t evidence. Mass-balance accuracy is one of the most diagnostic metrics available to a cashew processor or buyer precisely because it surfaces data integrity problems that wouldn't be visible from certification status or traceability depth alone.
Common reasons for mass-balance variance in cashew supply chains include moisture loss during storage or transit, which affects weight but is predictable and should be accounted for; grading losses where material is downgraded or rejected during processing; recording errors at input or output stage; and in more serious cases, lot mixing or misattribution. A well-designed traceability system records the reasons for variance as well as the variance itself, which allows genuine yield differences to be distinguished from data errors.
ISO 22005 guidance on traceability system design includes requirements for documenting the expected relationships between inputs and outputs, providing the framework for mass-balance checking. Module 1.1 covers the role of ISO 22005 alongside BRCGS and GFSI frameworks in the broader compliance picture.
Audit Metrics
BRCGS audit findings are categorised into three levels, and the distinction between them carries more information than the overall grade. But for professional buyers, the grade itself is the least useful part of an audit report. The real value lies in the pattern of findings over time.
Finding Categories
A critical finding indicates an immediate food safety risk and results in automatic failure of the audit. Critical findings are rare in established operations but require immediate corrective action and notification to the certification body.
A major finding indicates a significant failure to comply with a clause of the standard, or a pattern of minor findings in the same area that suggests a systemic issue. Major findings don't automatically fail an audit but affect the grade awarded and require evidence of corrective action before the certificate is issued or maintained.
A minor finding indicates a partial compliance failure or an isolated lapse that doesn't represent a systemic problem on its own. Minor findings in isolation carry limited weight, but a pattern of minor findings in the same clause area across multiple audit cycles may indicate that corrective actions are being closed on paper without addressing the underlying issue.
An observation is a note from the auditor that a practice, while compliant, carries a risk of non-compliance in future. Observations are sometimes overlooked in supplier evaluation because they don't affect the grade, but a supplier whose audit reports contain repeated observations in the same area is showing early warning signals worth monitoring.
How to Read Audit Reports as a Buyer
For buyers using audit reports as part of the evidence ladder described in module 1.5, four analytical questions are more informative than the grade alone.
Finding frequency: Are the number of findings decreasing or increasing across successive audits? A supplier moving from twelve minor findings to four over three audit cycles is demonstrating genuine improvement. One moving in the opposite direction warrants closer attention regardless of the overall grade.
Finding recurrence: Are the same clauses appearing in consecutive audit reports? Recurring findings in the same area strongly suggest that corrective actions have been closed administratively rather than by addressing the root cause. This is a more significant signal than a single major finding that was genuinely resolved.
Corrective action effectiveness: Were root causes identified and addressed, or were findings simply documented and signed off? An audit report accompanied by a corrective action plan that describes systematic process changes is more credible than one that lists procedural updates with no evidence of implementation.
Risk concentration: Where findings are concentrated matters as much as how many there are. Findings in critical food safety systems carry more weight than findings in peripheral administrative processes. Higher concern areas include HACCP verification, allergen management, traceability testing and supplier approval. These are the systems most directly connected to the hazards that make cashew a regulated product. Lower concern areas include documentation formatting and isolated procedural gaps that don't affect product safety outcomes.
A supplier with a B grade and a clean corrective action history, with findings concentrated in low-risk areas and decreasing in frequency, may represent lower ongoing risk than one with an A grade and recurring major findings in HACCP or allergen management.
Near-Real-Time Traceability Assurance vs Annual Snapshot
The annual certification model, where a supplier provides a valid certificate once a year and the buyer files it, has been the standard approach in cashew procurement for most of the sector's recent history. It's administratively simple and provides a defensible audit trail, but the certificate tells a buyer what the system looked like on the day of the audit, rather than what it looks like today.
The realistic objective for most cashew supply chains isn't continuous monitoring or live data feeds; it's near-real-time traceability assurance: a state where a buyer can obtain a reliable traceability record within minutes or hours rather than requiring manual reconstruction over several days. In practice, this means physical movement happens first, data capture follows at the next available opportunity, synchronisation occurs when connectivity allows, and verification occurs when requested. The value isn't instantaneity; it's the difference between a trace-back query that can be answered the same day and one that takes a week of document retrieval.
This distinction matters because 'real-time' as a concept can set unrealistic expectations, particularly for supply chains that include smallholder farmers without digital infrastructure or cooperative-level systems with intermittent connectivity. Near-real-time traceability assurance is achievable across most cashew supply chains with the right protocol design and data capture discipline. Continuous live monitoring is not yet standard and isn't necessary to meet the legitimate needs of buyers and regulators.
The practical difference for buyers is response time in an incident scenario. As documented in module 1.4, the difference between a contained incident and a costly one is often measured in hours. A buyer who can retrieve a complete lot record on demand is in a much better position than one waiting for a supplier to manually reconstruct a paper audit trail.
The technology layer supporting real-time verification, including lot databases, QR codes, RFID and where appropriate blockchain, is covered in module 1.3. What matters for the metrics framework is that freshness becomes a measurable KPI rather than an assumed property of a certificate that's less than twelve months old.
IFOAM's verification frameworks for organic certification provide a relevant reference point here: organic traceability requires documented chain of custody at each transaction point, which approximates the lot-level record update model that food safety traceability is moving toward. This convergence of organic and food safety traceability requirements is creating pressure for unified record-keeping systems that can satisfy both simultaneously.
Building a Traceability Dashboard That Buyers Will Trust
A traceability dashboard is a report or interface that makes a supplier's traceability metrics visible to buyers, investors or regulators in a structured, comparable format. Done well, it converts the data discipline described throughout this hub into evidence that external parties can evaluate. Done badly, it creates a document that looks impressive but doesn't survive scrutiny.
Before designing a dashboard, it's worth distinguishing between two different audiences and purposes. An operational dashboard is used internally by sourcing, production, quality and sustainability teams; its focus is gaps, corrective actions and performance improvement. An assurance dashboard is used externally by buyers, auditors and investors; its focus is evidence, compliance and transparency.
The strongest systems are those where the external assurance dashboard is generated directly from the internal operational management system rather than compiled separately for external audiences. A supplier who maintains one set of metrics internally and produces a different set for buyers is creating the reconciliation problem described in the Common Measurement Traps section below.
Design Principles for Traceability Dashboards
Show the Denominator
Every percentage needs a clearly defined base. Lot traceability coverage means something very different depending on whether the denominator is total volume, certified volume or volume shipped to a specific market. Buyers should ask for the denominator explicitly; suppliers should provide it without being asked.
Report Variance, Not Just Compliance
A dashboard that shows only green metrics is less credible than one that shows where variance occurs and what the supplier is doing about it. Mass-balance variances, audit findings and scanning gaps are more informative when disclosed than when concealed, and buyers with developed procurement programmes will see unexplained perfection as a warning sign rather than a reassurance.
Use Consistent Time Periods
Metrics reported over different periods are not comparable. A supplier who reports lot traceability coverage monthly and mass-balance accuracy annually is making it harder for a buyer to build a coherent picture of performance over time.
Separate System Metrics from Outcome Metrics
A system metric measures whether the traceability infrastructure is working: scan completion rates, record freshness, and mass-balance accuracy. An outcome metric measures what the system has achieved: contamination incidents detected, trace-back queries resolved within defined time windows, and regulatory submissions completed accurately. Both types are useful, but conflating them produces a dashboard that's harder to interpret.
Common Dashboard Failures
The most common failure is designing a dashboard around data that's easy to collect rather than being meaningful. Scan counts, certificate renewal dates and shipment volumes are easy to report but convey little about traceability quality. Traceability depth, mass-balance accuracy, audit finding trends and record freshness on the other hand, are harder to report but much more informative.
A second common failure is designing the assurance dashboard independently of the operational one. If a supplier's internal QA team monitors different indicators from those reported to buyers, the external dashboard is a presentation rather than a performance report. Experienced buyers and auditors will eventually identify the gap, and when they do it undermines confidence in both the data and the supplier relationship.
Reporting Metrics to Buyers, Regulators and Investors
The same underlying traceability data supports different reporting requirements for different audiences, and the framing needs to match the audience's decision-making context.
Buyers: typically want evidence that a specific lot can be traced back to origin on demand, that certification is current and in scope, and that the supplier's system has been tested under realistic conditions.
The most useful format is a combination of the evidence ladder described in module 1.5, including certificate, audit report, lot-level record access and evidence of an incident response test, rather than a standalone metrics report.
Regulators: are increasingly interested in a documented chain of custody, GPS-referenced origin data and evidence of due diligence processes rather than commercial traceability metrics.
The Corporate Sustainability Due Diligence Directive and the EUDR, covered in module 1.4, both require specific documentation formats that may not align with a supplier's standard traceability reporting. Building regulatory reporting requirements into the traceability system design from the outset is more efficient than retrofitting them later.
Investors and impact-focused partners: tend to be interested in outcome metrics alongside system metrics: how many farmers are registered and traceable, what proportion of volume carries Fairtrade or organic verification, and what the trend in audit findings looks like over time.
These metrics require origin-side data that not all cashew supply chains currently collect, which is itself an informative signal about the depth of a supplier's traceability investment.
It’s worth noting that consistency across all three audiences is important. A supplier who reports different traceability coverage figures to buyers, regulators and investors because each calculates the metric differently creates reconciliation problems that can surface as credibility issues in due diligence processes.
Common Measurement Traps
Traceability metrics, like any performance metric, can be gamed, can drift over time without anyone noticing, or can appear comparable across suppliers when they're actually measuring different things.
Gaming
Gaming occurs when a metric is optimised in ways that improve the reported number without improving the underlying performance it's supposed to measure. In traceability, common examples include reporting lot traceability coverage only for the product grades or customer channels where the system works well; closing audit findings on paper without implementing the corrective action; and reporting mass-balance accuracy over time periods that exclude the months where variance was highest.
The most effective guard against gaming is requiring suppliers to report the methodology alongside the metric: how the number was calculated, what was included and excluded, and how it compares to the previous reporting period. Methodological transparency makes gaming significantly harder and makes genuine improvement easier to identify.
Drift
Drift occurs when a metric that was accurate at the time a system was implemented gradually becomes less accurate as processes, personnel or supplier relationships change. A mass-balance tolerance calibrated for one processing configuration, for instance, may no longer be appropriate after a facility upgrade.
Metrics should be reviewed at defined intervals, at minimum annually and whenever there is a significant change to the supply chain, processing configuration or certification scope. This ensures they're still measuring what they were designed to measure.
False Comparability
False comparability occurs when two suppliers report the same metric using different definitions and a buyer treats the numbers as directly comparable. Traceability depth is a particularly common example: one supplier might count a cooperative as a single tier, while another counts each individual farmer within the cooperative as a separate tier, producing very different depth figures that reflect methodological differences rather than actual differences in traceability capability.
The solution is to agree on metric definitions before requesting supplier data, to include the definition in the reporting template, and to verify that each supplier has applied it consistently.
GS1's Global Traceability Standard provides a basis for standardised definitions that reduces the false comparability problem, and buyers who reference it in their supplier reporting requirements are more likely to receive data that's genuinely comparable.
This module closes the Supply Chain Transparency and Traceability hub. The sustainability and environmental dimensions of cashew supply chain performance are covered in Part 2, Sustainability and Regenerative Practices, though the connection between the two parts is direct and worth making explicit here.
Traceability metrics are increasingly the evidence layer behind ESG and sustainability claims. Deforestation commitments require farm coordinates and land-use history to be verifiable. Farmer welfare programmes require registered producer lists and documented participation data. Carbon accounting requires farm boundaries and production practice records. And human rights due diligence requires supplier mapping and worker information at cooperative and facility level. So, without the traceability infrastructure described across this hub, each of these sustainability claims becomes difficult to verify and increasingly difficult to defend under regulatory scrutiny.
The metrics and frameworks in this module - depth, breadth, freshness, data integrity, mass balance, audit patterns and dashboard discipline - are not ends in themselves. They’re the measurement layer that makes sustainability commitments demonstrable rather than declarative. Part 2 examines what those commitments look like in practice across regenerative agriculture, agroforestry, climate adaptation, ESG reporting and ecological monitoring. The traceability foundation built in Part 1 is what makes the evidence behind those commitments credible.
For enquiries about supplier metrics, traceability dashboards, or sourcing programme design, please get in touch.
Evidence and methodology: you can learn about our source vetting standards, data attribution policy, editorial independence and amendment policy here.